How do I view and edit the map representation?
Introduction
Some entries in the system can be represented on a map, such as sites. When you first add an entry of this type, you have the option of entering a coordinate pair (e.g. latitude/longitude) to represent it as a point. This will allow users to view the entry on a map. By editing the map representation, you will also be able to show different physical features including locations, areas and tracks.
Steps
Viewing the Map Representation
The map interface is visible as various times when using the system and it can display map-based information such as GPS points, lines and polygons. If viewing a specific entry, the map representation will be visible under the 'Default view' if a coordinate pair was assigned to the entry when it was created. If an entry does not contain a coordinate pair, this can be added by clicking 'Edit' (see adding a site for more information about entering a coordinate pair).
There are three different screen views in the system:
- Default view, in which a map is displayed, along with text
- Content view, in which only the text is displayed
- Map view, in which only a map is displayed
You can toggle between the views as shown in the recording below. Note: in some systems these views may be labelled slightly differently. In some parts of the system, you will only be able to toggle between the default view and the content view.
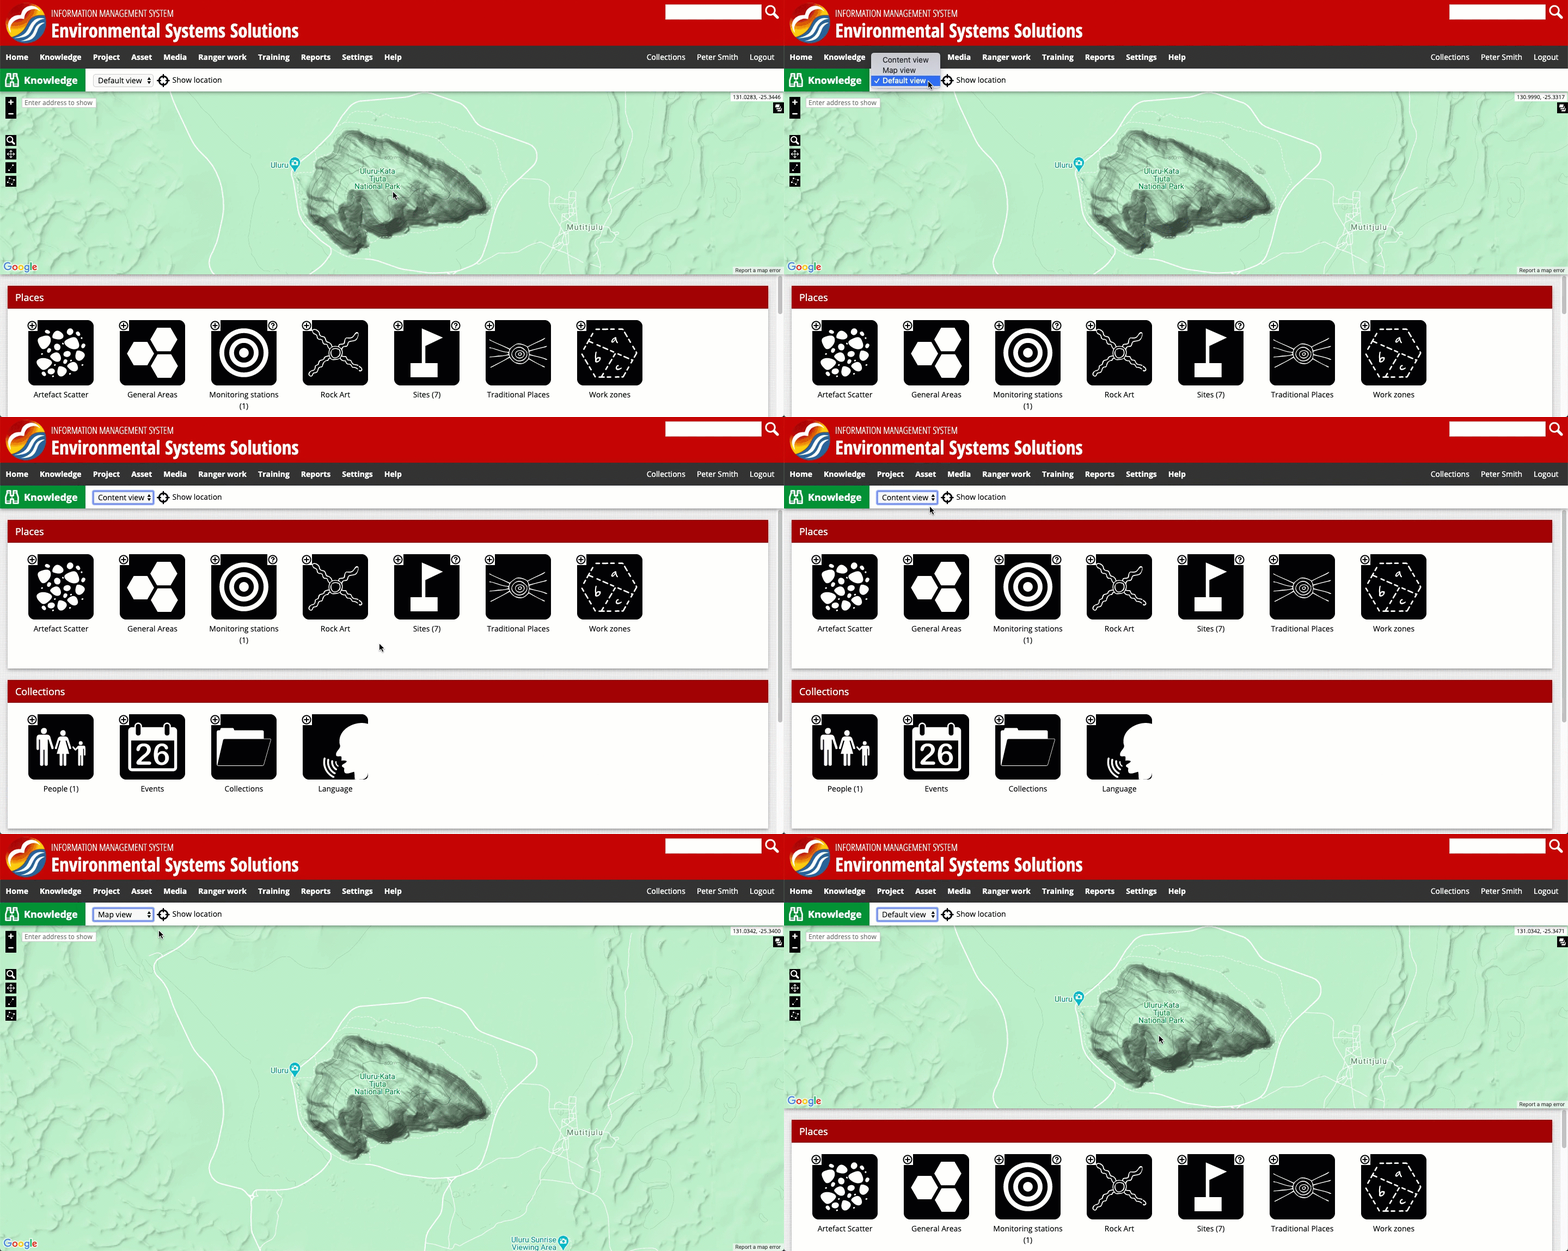
The three screen views available for viewing the map representation in the system.
Browsing the Map Representation
The map representation contains tools that allow you to move around the map, zoom and choose features to view in more detail.
-
Map layers: The layer options are located in the top-right corner of the representation. These control what information is shown on the map and how it is represented on the screen. Map overlays can show the location of particular entries in the system, for example sites or burial places. This is also where the base layer (Google Terrain, Google Hybrid or Open Street Map) of the map is selected.
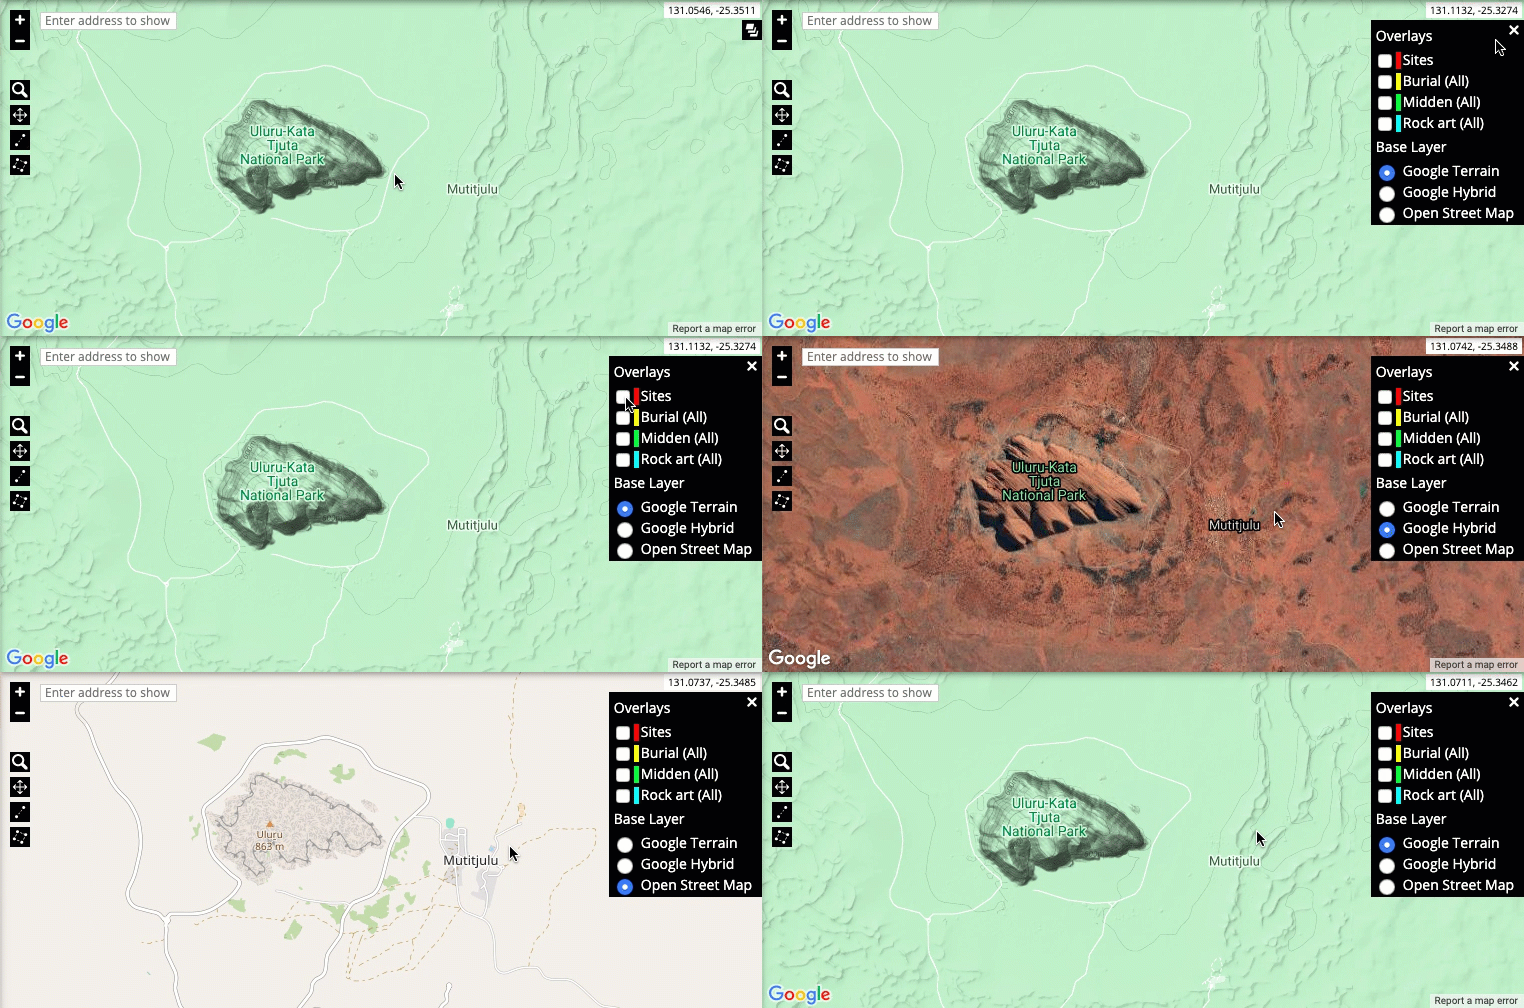
-
Zooming and moving around the map: The zoom level of the map is controlled by the + and - buttons in the top-left corner, or by using the mouse scroll wheel. To zoom in on a particular region, click on the magnifying glass and select the region. You can move around the map by left-clicking and holding using your mouse. Move the mouse to move around the map
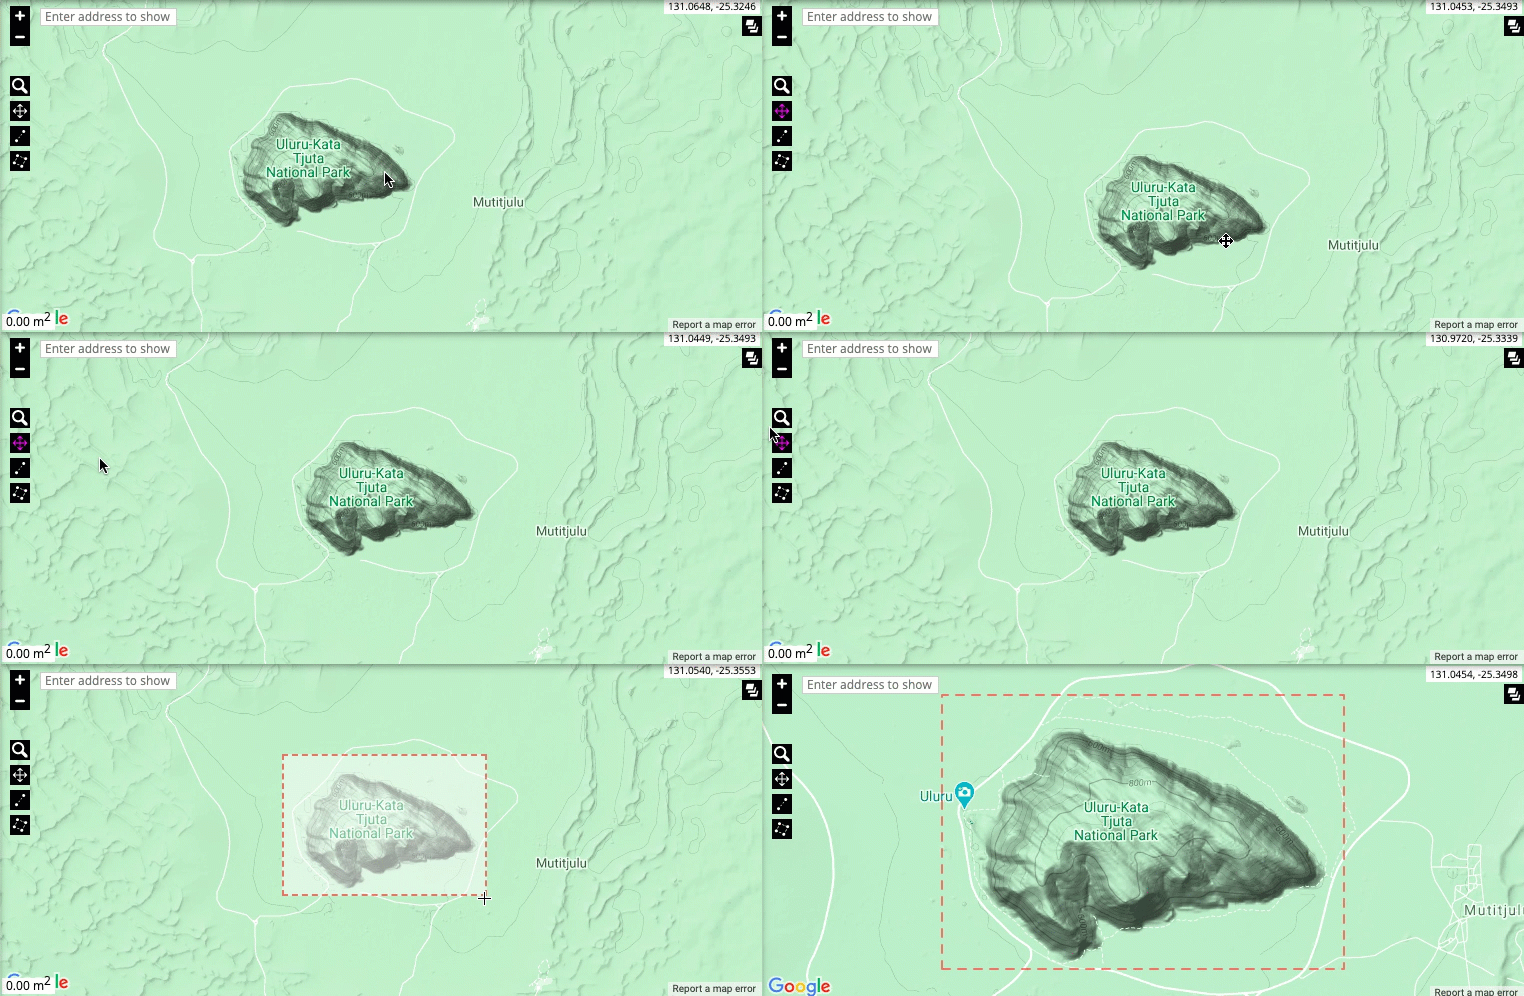
-
Measuring tools: The map allows you to measure the straight-line distance between any number of points, as well as the total area of a particular region. Click on a point to include it in your measurement, and double-click to stop measuring. The measurements will automatically appear in the bottom-left corner of the map representation.
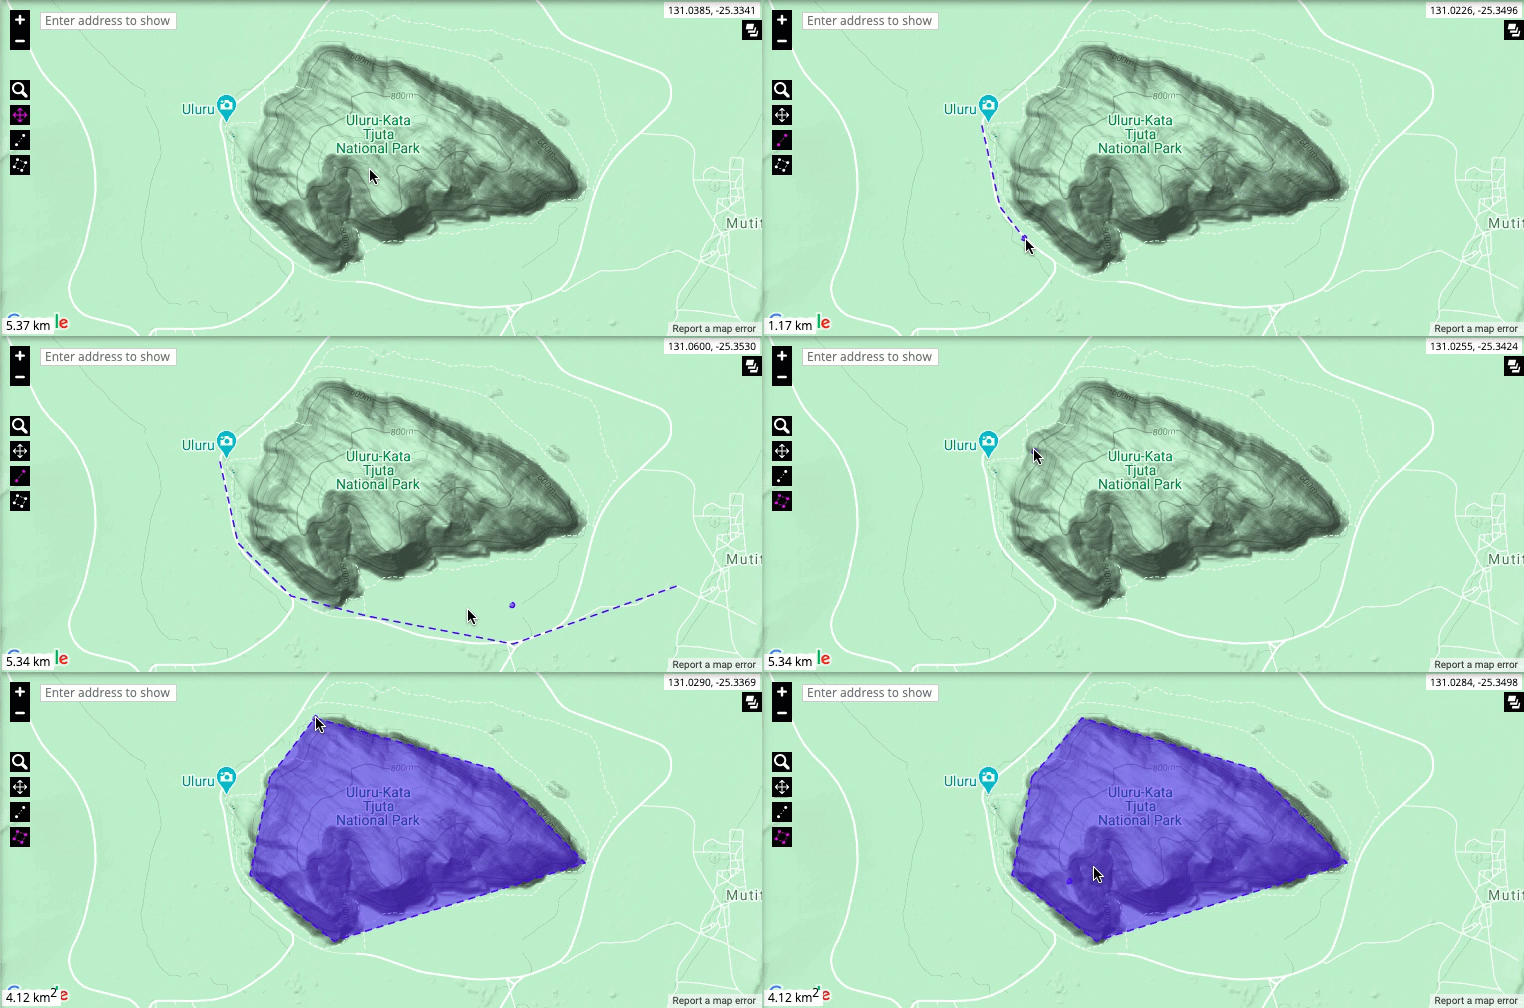
Editing the Map Representation
The map representation for specific entries can be edited to include additional information. Click on the 'Draw' ('world' icon) to enter the edit map representation page. This page provides you with a map to draw on (using the map toolbar), as well as some tools for entering coordinates manually or loading from GIS files.

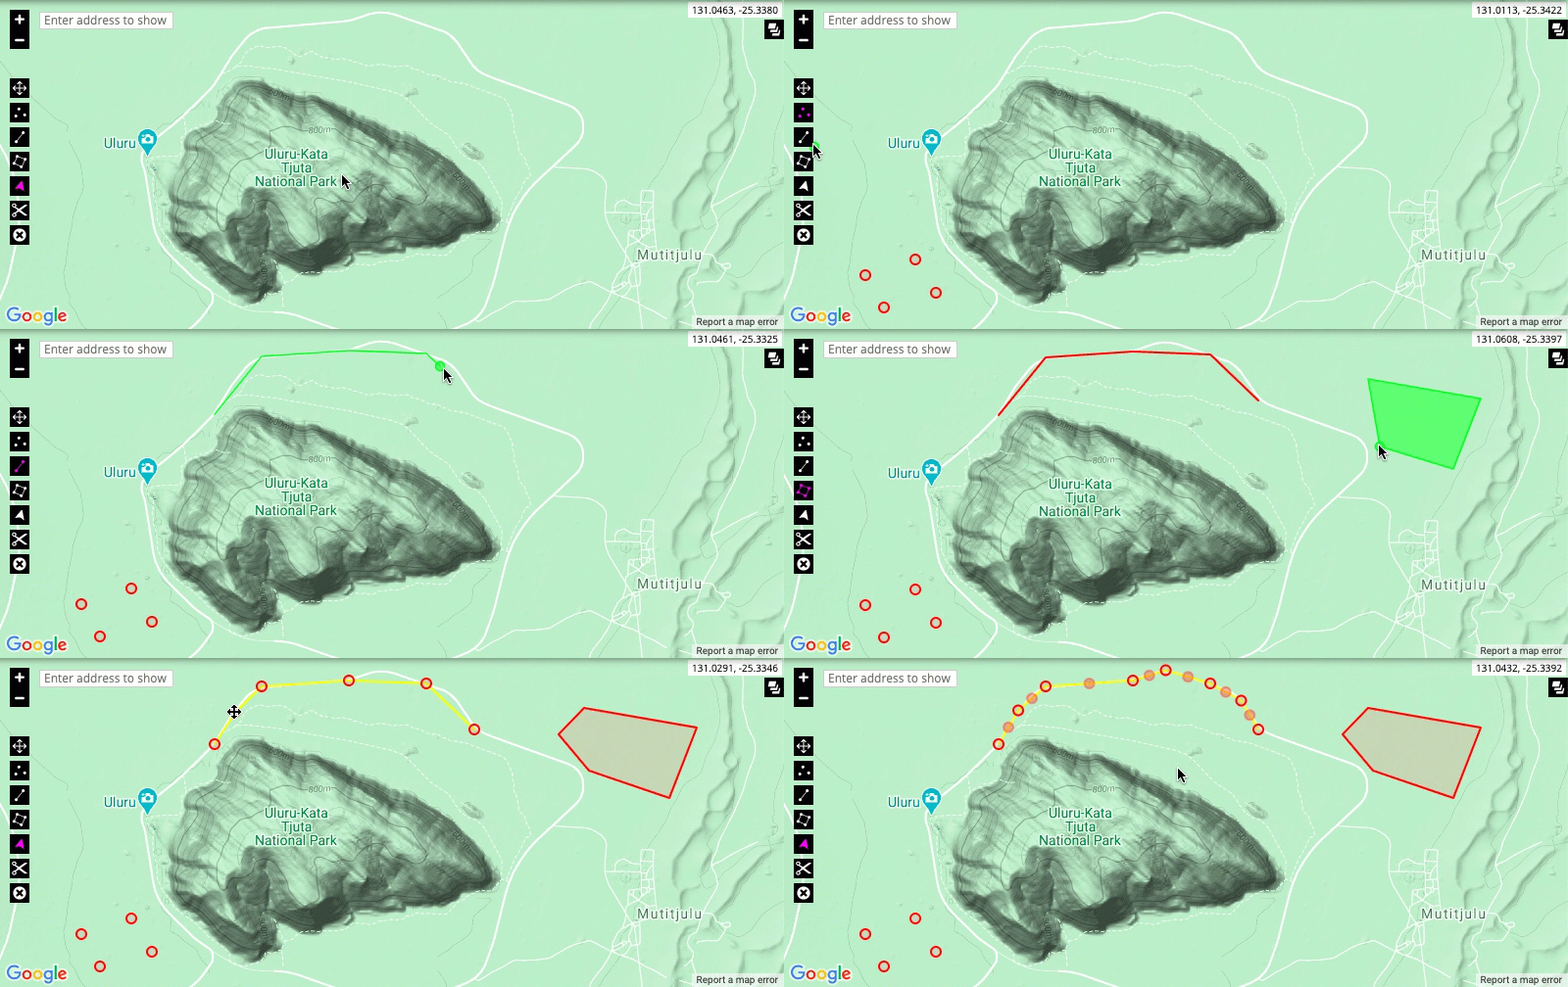
The following recordings show the different functions of the map toolbar. To finalise your changes, click the 'Update' button provided in the main toolbar after drawing.
- Draw and modify points, lines and areas: Using the tools shown below, you can draw points, lines and areas onto the map representation for an entry in the system. To edit existing drawings on an entry, use the modify tool as shown.
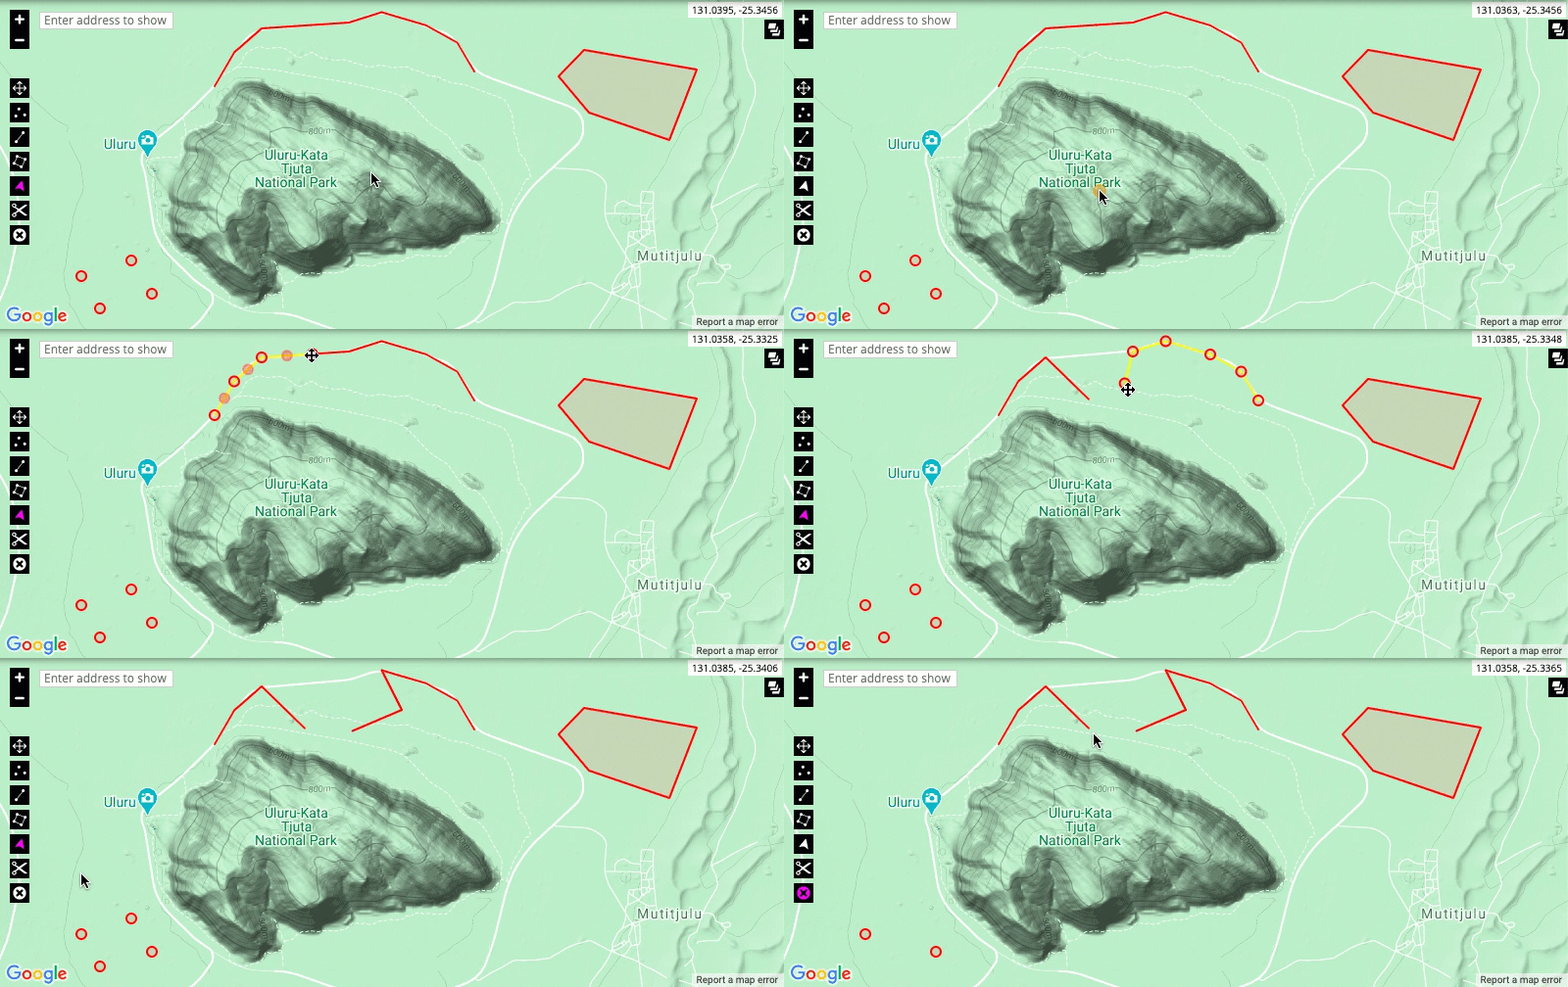
- The split and delete tools: The split tool allows you to split a drawing at a particular point, allowing you to edit the new sections of the drawing separately. The delete tool allows you to remove a drawing from the map.
Add new point via longitude/latitude
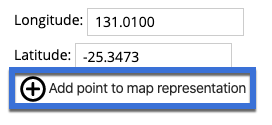
Points can be added to the map representation manually using a longitude/latitude coordinate. Coordinates must be entered using decimal degree notation, taking care to specify a negative latitude for locations in the southern hemisphere.
Entering coordinates from GPS or other sources
-
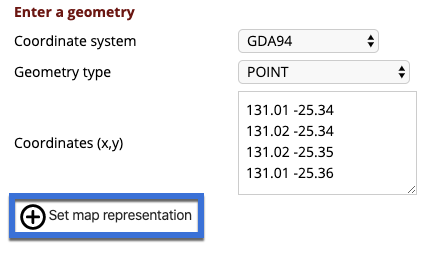
The coordinate system needs to be selected based on the source coordinates that you are entering.
-
The geometry type must be selected to define what type of shape will be created on the map from the coordinates entered.
- Point - creates a single point at the coordinate you enter
- Multipoint - creates multiple points at the coordinates you enter
- Line - creates a line joining up the coordinates you enter
-
Polygon - creates an area joining up the coordinates you enter and closing the shape back to the first point
-
When entering features, you enter the coordinates as shown below. Ensure that you enter each coordinate on a separate row and that there is a space separating the longitude/latitude or easting/northing pair.
Loading from a GIS shapefile
A tool is provided for loading a map representation from a GIS shapefile. The shapefile should only represent the entry of interest and be carefully prepared by GIS staff.
-
Specify the *.dbf, *.shp, *.shx and *.prj files to upload.
-
Click the button to upload the shapefile and create the feature within the map.
